A first post — what this site is about and a quick demo of the tools behind it.
Author
Noam Sellam
Published
February 10, 2026
Hello, world
Welcome to my corner of the internet. This blog is where I’ll share data science projects, interactive dashboards, and things I find interesting along the way.
The site is built with Quarto and deployed to Cloudflare Pages. Posts can include live R and Python code, and I plan to embed interactive Shiny dashboards directly into articles.
A quick demo
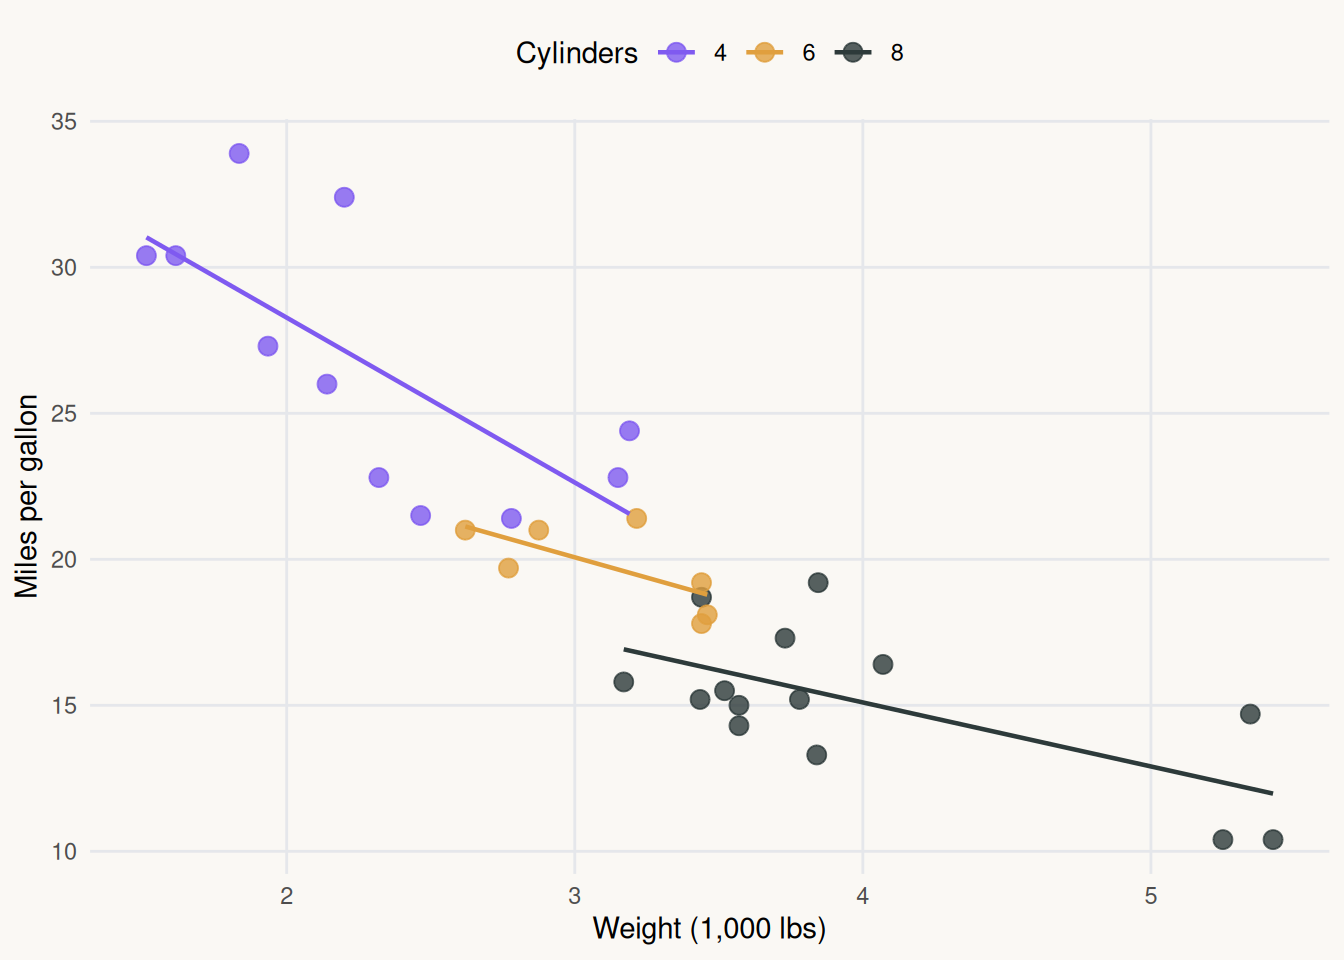
Here’s a simple visualization to make sure the R pipeline is working. Let’s look at the relationship between car weight and fuel efficiency:
Code
library(ggplot2)ggplot(mtcars, aes(x = wt, y = mpg, color =factor(cyl))) +geom_point(size =3, alpha =0.8) +geom_smooth(method ="lm", se =FALSE, linewidth =0.8) +scale_color_manual(values =c("4"="#7F5AF0", "6"="#E09F3E", "8"="#2D3A3A"),name ="Cylinders" ) +labs(x ="Weight (1,000 lbs)",y ="Miles per gallon" ) +theme_minimal(base_family ="sans") +theme(plot.background =element_rect(fill ="#FAF8F4", color =NA),panel.background =element_rect(fill ="#FAF8F4", color =NA),panel.grid.minor =element_blank(),panel.grid.major =element_line(color ="#E5E7EB"),legend.position ="top" )
Figure 1: Fuel efficiency drops as vehicle weight increases — no surprises there.
The colors above match the site’s Ember & Violet palette — violet for the primary data series, amber for the secondary, and deep forest for the third.
This post was generated as part of the initial site setup. Real content starts next.
What’s coming
Deep dives into datasets I find interesting
Interactive Shiny dashboards embedded right in the posts
Technical notes on R, Python, and data engineering
Stay tuned.
Source Code
---title: "Welcome to My Blog"description: "A first post — what this site is about and a quick demo of the tools behind it."author: "Noam Sellam"date: "2026-02-10"categories: [news, R, Data-viz]draft: false---## Hello, worldWelcome to my corner of the internet. This blog is where I'll share data science projects, interactive dashboards, and things I find interesting along the way.The site is built with [Quarto](https://quarto.org) and deployed to Cloudflare Pages. Posts can include live R and Python code, and I plan to embed interactive [Shiny](https://shiny.posit.co/) dashboards directly into articles.## A quick demoHere's a simple visualization to make sure the R pipeline is working. Let's look at the relationship between car weight and fuel efficiency:```{r}#| label: fig-mpg#| fig-cap: "Fuel efficiency drops as vehicle weight increases — no surprises there."#| warning: falselibrary(ggplot2)ggplot(mtcars, aes(x = wt, y = mpg, color =factor(cyl))) +geom_point(size =3, alpha =0.8) +geom_smooth(method ="lm", se =FALSE, linewidth =0.8) +scale_color_manual(values =c("4"="#7F5AF0", "6"="#E09F3E", "8"="#2D3A3A"),name ="Cylinders" ) +labs(x ="Weight (1,000 lbs)",y ="Miles per gallon" ) +theme_minimal(base_family ="sans") +theme(plot.background =element_rect(fill ="#FAF8F4", color =NA),panel.background =element_rect(fill ="#FAF8F4", color =NA),panel.grid.minor =element_blank(),panel.grid.major =element_line(color ="#E5E7EB"),legend.position ="top" )```The colors above match the site's **Ember & Violet** palette — violet for the primary data series, amber for the secondary, and deep forest for the third.> This post was generated as part of the initial site setup. Real content starts next.## What's coming- Deep dives into datasets I find interesting- Interactive Shiny dashboards embedded right in the posts- Technical notes on R, Python, and data engineeringStay tuned.